Economic Complexity is a methodology that measures the degree of knowledge that an economy accumulates about its different productive activities. Based on mapping of these activities, it makes it possible to diagnose the complexity of each region and plan a development perspective based on its capabilities. But what are the benefits of this method of analysis? An introductory guide to its operation in a provincial perspective based on employment data.
Economic Complexity is based on the idea that it is possible to infer how similar economic activities are to each other based on the capabilities required for their development. These capabilities refer to all the specific knowledge needed to produce a given good. To this end, Economic Complexity analyzes existing capabilities and how they are distributed among productive activities within the economies where they are developed. In this way, the EC allows us to infer the complexity of each region according to its acquired capabilities.
Economic Complexity Utility
Economic Complexity from Employment Data
In its beginnings, the EC methodology was based on export data. Numerous papers apply this approach to the analysis of Argentina (several of them can be found at this link). Over time, the literature expanded the data for calculating the EC, including other sources, such as employment or patent data.
This toolbox uses employment data to estimate the EC in the Argentine provinces. More specifically, data on registered salaried employment are used, excluding public employers that are not public companies and private household personnel, as they have a special regime. Private registered wage earners represent 60% of total wage earners and 48% of all registered workers (Ministry of Labor, 2023). This perspective has some advantages and disadvantages. Among them, the most important are the following:
- Advantages:
– Greater disaggregation of activities.
– Greater geographic disaggregation.
- Disadvantages:
– It is not comparable with the rest of the world.
– It does not capture non-registered activities.
Based on these data, this paper proposes to calculate the first CE indicators to evaluate the current productive framework of the Argentine provinces. Three dimensions and indicators are used for this purpose:
- Revealed Comparative Advantages (RCA), which indicates the degree of economic specialization of a region.
- Economic Complexity Index (ECI), which measures provincial complexity.
- Activity Complexity Index (ACI), which estimates the complexity of economic activities.
An example: Economic Complexity analysis of the province of Cordoba

For the prospection of sectors or activities, the EC analysis uses two additional indexes, complementary to the indicators presented. These make it possible to evaluate the affinity between the various economic activities and the province: proximity and strategic value.
The proximity index measures the propensity of a province to develop a new economic activity. The propensity calculation arises from the analysis of the productive matrix and the capacities developed by it.
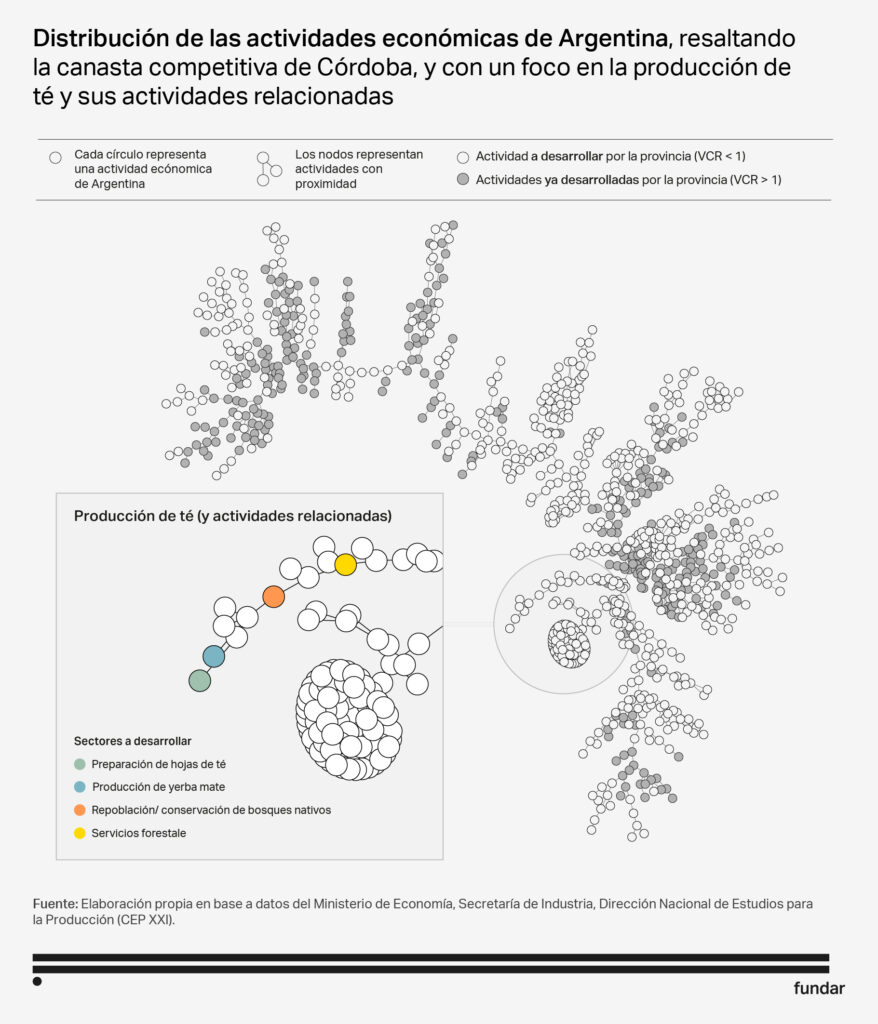
For example, this index allows us to estimate how close Cordoba is to specializing in telecommunications services via the Internet. This propensity is given by the distance ratio between specific products and the productive basket of the province that is similar to this activity. Based on this systematization, we can affirm that the products close to the province of Córdoba will be those that are at a low proximity (or at a few nodes) of those activities in which Córdoba is already specialized (in grey in the graph).
The strategic value (SV) of an activity for a province measures how much a province would benefit from specialization in a new sector. This measurement is made in terms of the gains in productive capacities that facilitate the future development of more complex activities.
To understand this concept, let us consider the details of the network. In the case of Córdoba, the strategic value analysis estimates, given the activities where the province has Revealed Comparative Advantages (coloured nodes), how much specializing in a productive node (in white) would bring it. This is weighted in terms of how much it brings it closer to producing new complex activities.
In this case, we take the case of tea (in the detail of the graph). The strategic value of developing this activity in Córdoba tells us how much it would bring its production basket closer to other different nodes. If the strategic value of an activity is positive, it implies that including its production in that province will bring it closer to other complex activities, and vice versa. If the strategic value is negative, it implies that this product does not bring productive capacities closer to new, more complex products. This translates, in the network, into a greater distance from other complex products.
An approach to a particular activity
In the same way that we can select which sectors to prioritize or promote in a particular province or region, we can also go the opposite way and find in which provinces it is more propitious to promote an activity. The intention of doing one or the other will respond entirely to the interest that the user of the tool has in it.

We are going to take an activity as an example: the manufacture of medicines for human use and pharmaceutical products. First, let’s gather what we know about it. In total, drug manufacturing has 32,536 registered jobs throughout the country and a complexity of 0.29. The provinces of Buenos Aires, La Rioja and San Juan are the only ones specialized in this activity.
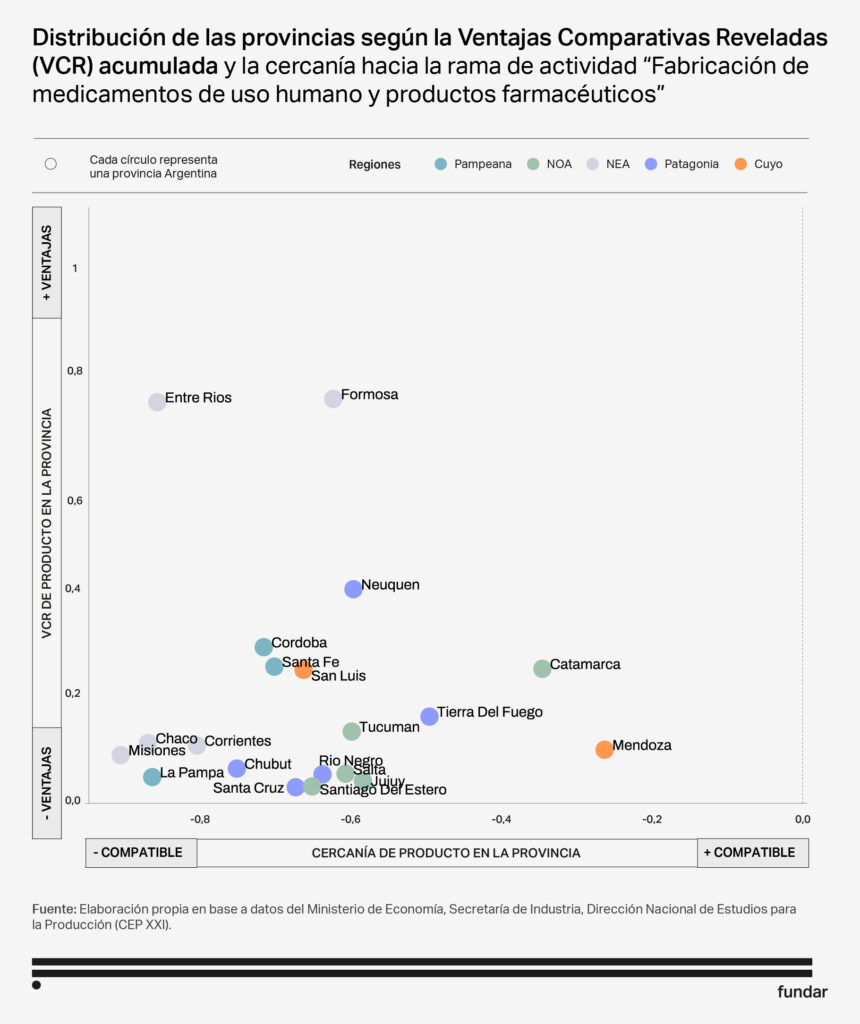
Now, which other provinces could be interesting locations to develop this activity? We can obtain some indications of this by looking at the accumulated RCA in each province and the proximity of the productive basket of that province to the product.
We then identify that Entre Ríos and Formosa are the provinces that are closest to specializing in this activity. However, although they have relatively more employees in this activity, they do not have the greatest capacity to transition. Mendoza, on the other hand, is the province that has accumulated more capacities to develop this activity. However, relatively speaking, it does not have so many employees in medicine, so it is not close to specializing in this.
This link provides access to the repository of data used in this guide. The link provides access to the repository containing the calculations and databases used to generate the analyses presented in the document. The data sources are those of registered employment by activity and department, published by the Ministry of Economy, Secretariat of Industry, National Directorate of Studies for Production (CEP XXI).

